
Our first look at QuantumLayers made the case for the product in broad strokes. Most companies have plenty of data spread across databases, spreadsheets, SaaS tools and CSV exports, and few have someone with time to pull it together and analyze it. QuantumLayers promises to do that work for you: connect the sources, merge them, run the statistics automatically and explain the results in plain language.
That overview left a lot of questions open. Which databases does it actually support? How does merging work when your sources don't line up neatly? What does "analyze automatically" mean in practice, and how much can you trust it? What happens after the first analysis, when the data keeps changing?
This article answers those questions. It walks through the platform in the order you'd use it, from connecting a first data source to getting an alert when something important changes. Along the way it uses a real example: a public dataset of 151,445 AI, machine learning and data salaries, which shows what the analysis output looks like and how to read it.
Getting data in
Everything in QuantumLayers starts with a dataset, and a dataset can come from almost anywhere business data lives. The platform supports seven kinds of source, and the details of each matter more than a list of logos suggests.
SQL databases. QuantumLayers connects directly to MySQL, PostgreSQL, Microsoft SQL Server, Amazon Redshift, ClickHouse, Azure Synapse, Google BigQuery and Databricks. You give it the connection details and a SELECT query, and the query's result becomes the dataset. BigQuery connects with a service-account key and Databricks with a personal access token, the same credentials your engineers would use. Because the dataset is defined by a query, you can pull exactly the slice you need, such as last year's orders or active customers only, without copying the whole database.
REST APIs. Any endpoint that returns JSON can become a dataset. This covers CRM and SaaS platforms, internal services and public data sources. The connector handles API keys and bearer tokens, custom request headers, and GET, POST or PUT requests with a request body. JSON responses often bury the actual rows inside a wrapper, so QuantumLayers lets you give a path to the data, such as "response.data" or "observations." If you leave it blank, the platform tries to find the rows itself. Public sources like the World Bank, FRED, the US Energy Information Administration and Open-Meteo all work this way.
Google Sheets. Point QuantumLayers at a spreadsheet, choose a tab and optionally a cell range, and the sheet becomes a dataset. This matters more than it sounds, because in many small companies the most important data is in a spreadsheet someone updates by hand every week.
Files from a URL. CSV and Excel files can be imported from a link, which suits exports that land in shared storage.
SFTP servers. Many older systems, and many vendors, still deliver data as files dropped on an SFTP server overnight. QuantumLayers can collect a named file from a remote directory, using either a password or an SSH key.
Kaggle. Public Kaggle datasets can be pulled in directly, which helps when you want benchmark or market data next to your own.
File uploads. You can also upload a file directly. Our salary example was loaded this way.
Connected sources don't go stale. Database, API, Google Sheets, SFTP and Kaggle datasets can be re-synced on demand, so the dataset reflects the current state of the source. If credentials change, for example a rotated database password or a new API key, updating the dataset settings triggers a fresh sync to confirm the new values work before you depend on them.
Every dataset also has a visibility setting. Private datasets are visible only to you, organization datasets are shared with your team, and public datasets can be viewed by anyone. That makes it straightforward to keep sensitive financial data private while sharing an operational dataset with colleagues.
Merging sources into one picture
Connecting sources is useful. Combining them is where most of the value is. The questions that matter usually cross system boundaries. Do customers who use a particular feature renew more often? Does support ticket volume predict churn? Does marketing spend in one channel actually show up in revenue?
QuantumLayers merges two or more datasets into a new one by joining them on a shared column, such as a customer ID, an account email or a date. It supports the four standard join types, and choosing the right one matters.
An inner join keeps only the rows that appear in both datasets. If you join your CRM to product usage this way, you get customers who exist in both systems, which is clean but silently drops anyone missing from either side.
A left join keeps every row from the first dataset and adds matching information from the second where it exists. Starting from your customer list and left-joining support tickets keeps every customer, including the ones who never filed a ticket. That is usually what you want, because those customers are often the most interesting comparison group.
A right join does the reverse, and an outer join keeps everything from both sides, filling gaps with blanks. An outer join is a good way to audit how well two systems agree: rows that only appear on one side point to customers or records your systems disagree about.
The merged result is saved as a dataset in its own right. Every analysis, chart, report and monitor described below works on merged datasets exactly as it does on single-source ones, and you can merge more than two sources in one step.
Automated statistics: what QuantumLayers actually computes
Once a dataset is ready, QuantumLayers runs several analyses automatically. Each answers a different kind of question, and each produces more detail than a single headline number.
The statistical summary
For every numeric column, the summary reports the count, missing values, minimum and maximum, mean, median, standard deviation, first and third quartiles, skewness and kurtosis.
This is the least exciting output and the most underrated. It's the first place data problems show up. In our salary dataset, the raw salary column had a maximum of 30.4 million, a standard deviation larger than its mean and a skewness above 63, which is extreme. The reason was that the column mixed 26 currencies, so Indian rupees and Hungarian forints sat next to US dollars. The separate column converted to US dollars looked healthy: a median of $146,100, a mean of $157,527, and a moderate skew of 1.35 caused by a minority of high earners. Thirty seconds with the summary told us which column to trust before we analyzed anything.
The same pattern turns up in business data all the time: revenue stored in cents in one system and dollars in another, test accounts with absurd values, or monthly and annual figures in the same column. The summary is where you catch them.
Correlation matrices
QuantumLayers measures how strongly every pair of numeric columns moves together, using two methods. Pearson correlation measures how well a straight line fits the relationship, and it is sensitive to extreme values. Spearman correlation works on rankings instead of raw values, so it captures any consistently rising or falling relationship and resists outliers.
Having both is more useful than it sounds, because when they disagree, the disagreement is a finding in itself. In the salary data, Pearson correlation between the local-currency salary and the US-dollar salary was only 0.32, which is strange for two columns that describe the same paychecks. Spearman correlation on the same columns was 0.985. The gap pointed straight at the currency problem: within each currency the ranking was almost perfectly preserved, but a few huge local-currency figures were dragging the straight-line fit apart. In your own data, a large gap between the two usually means outliers, mixed units or a relationship that curves rather than running in a straight line.
ANOVA: do the groups really differ?
Many business questions compare groups. Do enterprise customers spend more than small businesses? Does churn differ by region? Do annual plans retain better than monthly ones? QuantumLayers answers these with analysis of variance (ANOVA), run automatically for every combination of a category column and a numeric column.
Each test reports the F-statistic and p-value, which indicate whether the differences between groups are larger than chance would explain. More importantly, it reports effect sizes. Eta squared is the share of the total variation explained by the grouping, and Cohen's d measures the gap between the two most different groups in standard-deviation units. QuantumLayers also reports the underlying sums of squares, degrees of freedom and group counts, so an analyst can check the arithmetic.
Effect sizes matter because on large datasets nearly everything is "statistically significant." In the salary data, with 151,445 rows, every grouping produced a p-value close to zero, including company size and remote-work status. Their effect sizes told a different story. Experience level explained about 10% of the variation in pay, and job title about 20%. Company size explained about one-tenth of one percent, and remote status less than half of one percent. Both were real in a statistical sense and irrelevant in a practical one. Experience level was the clear finding: the median salary rose from $86,600 for entry-level roles to $130,000 for mid-level, $161,000 for senior and about $189,000 for executives.
The lesson for any team is to read effect sizes first. A statistically significant difference that explains a fraction of a percent of what you're measuring is not a reason to change a strategy.
Ranked insights and AI explanations
The individual analyses feed into QuantumLayers' insight generation, which scans a dataset and returns a ranked list of its most notable findings: strong relationships, meaningful group differences, unusual distributions and, for time-based data, trends and seasonality. You can control how many findings it returns, restrict it to the columns you care about, and filter it to one segment, such as a single region or product line, to see whether a pattern holds within it.
You can also give it a focus in plain language, such as "focus on seasonal trends" or "what drives renewal rates," and ask for a written narrative. The narrative is the AI layer the first article described: instead of just reporting a correlation of 0.72, it explains what the relationship means, how strong it is and why it might matter.
Forecasting
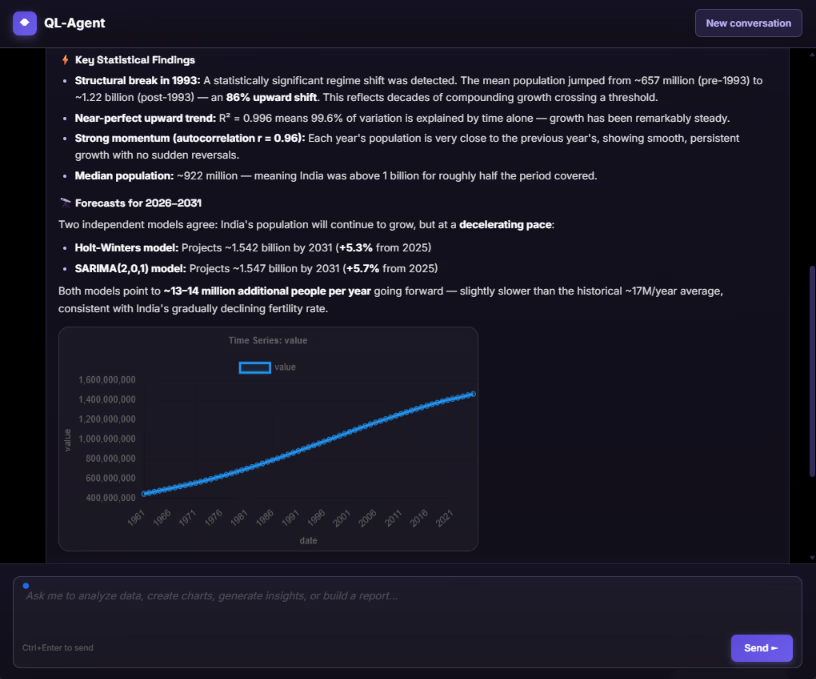
When a dataset has a date column with at least 12 periods of history, insight generation adds time-series analysis. It detects trends and seasonal patterns and produces forecasts using two established methods. Holt-Winters exponential smoothing tracks level, trend and seasonality and works well for steady business series like monthly revenue or weekly signups. SARIMA, a seasonal variant of the classic ARIMA model, handles series with more complex patterns over time. Both are standard forecasting tools that would normally take an analyst and some code to set up. In QuantumLayers they appear as one more kind of finding.
The 12-period minimum is worth respecting rather than resenting. A year of monthly data is about the least you need to tell a seasonal pattern from a coincidence, and forecasts built on less tend to look confident while being unreliable.
Charts that choose themselves
Choosing the right chart is a skill, and the wrong choice can hide a pattern or invent one. QuantumLayers analyzes a dataset and returns a ranked list of recommended charts. Each recommendation names the chart type, the columns it uses and a short reason it was chosen. A category against a number might become a bar chart, two numeric columns with a strong correlation a scatter plot, and a date column with a measure a line chart.
Recommendations you want to keep can be saved, so a carefully chosen view doesn't have to be rebuilt later, and any saved chart can be shared by link. That makes it easy to drop one chart into a Slack thread or an email without exporting screenshots or giving the recipient an account.
SQL without writing SQL
Some teams have their data in a database but no one comfortable writing queries against it. QuantumLayers includes a query generator for exactly this situation. You connect to a database, the platform reads the schema (the tables, columns and how they relate), and you describe what you want in plain English, such as "monthly revenue by product line for the last two years" or "customers who signed up in 2025 but haven't logged in for 30 days." It returns a SELECT query along with an explanation of what the query does.
The generator supports the same eight database engines as the data connectors and writes the correct dialect for each. The explanation is the important part: it lets a non-specialist confirm the query asks the question they meant before turning its result into a dataset. Because the generator only produces SELECT queries, it reads data and never changes it.
Beyond one-off analysis: reports
An analysis you run once is useful once. Most business data changes daily, and the questions people ask about it recur: How did last week look? What changed this month? QuantumLayers handles this with scheduled reports and statistical monitors, available on its Connect and Pro plans.
A scheduled report bundles analysis from one or more datasets and emails it to a list of recipients on a daily, weekly or monthly schedule, at a set time in a chosen time zone. Reports arrive as PDF, HTML or both.
Each dataset becomes a section of the report, and each section can be configured separately. It can include automatically generated insights, with a cap on how many and an optional focus prompt; a set of automatically suggested charts; and any saved charts you've built by hand. A weekly operations report might combine a sales dataset with ranked insights and two hand-picked charts, followed by a support dataset with its top five findings. The report is regenerated from current data each time it runs, so it never shows last month's numbers by mistake.
Reports can also be run on demand. That's useful for checking a new report before its first scheduled delivery, or for sending an extra update after a big data change.
Monitors: alerts when the statistics change
Reports tell you how things look on a schedule. Monitors tell you when something changes, which is often more valuable.
A monitor watches one or more datasets and periodically recomputes their statistical findings. When a finding appears that wasn't there before, such as a new correlation, a group difference that has become significant or a shift in a trend, or when an existing finding disappears, the monitor sends an alert. Monitors can run every hour, day, week or month, and you can limit each one to specific columns, cap how many findings it tracks per dataset and filter it to one segment or a date range.
The difference from a typical dashboard alert is important. Most alerting tools watch thresholds you set in advance: revenue below a number, error rate above a number. That only catches problems you already anticipated. A QuantumLayers monitor watches the statistical structure of the data, so it can flag relationships nobody thought to set a threshold for. For example, it might notice that support ticket volume has started to correlate with churn in a segment where it previously didn't.
Monitors deliver alerts three ways. Email sends a formatted summary in HTML, PDF or both. Slack posts to a channel through an incoming webhook. For technical teams, a generic webhook sends each new or disappeared finding as a structured event to any HTTPS endpoint. Webhook events are signed with a secret key so the receiving system can verify they genuinely came from QuantumLayers. A cooldown window prevents the same finding from firing repeatedly while it flickers around a threshold, and delivery can be limited to particular types of finding. That means a monitor can feed directly into an internal tool, a ticketing system or an automation workflow, not just an inbox.
Working with AI agents
QuantumLayers also exposes its capabilities to AI agents through the Model Context Protocol (MCP), an open standard for connecting agents such as Claude to outside tools. With the connection set up, you can ask an agent to list your datasets, run a correlation or ANOVA, generate insights, recommend charts, merge sources or create a report, all in conversation. The agent calls QuantumLayers to do the computation and then explains the results.
This combination plays to each side's strength. The agent handles the conversation and the explanation, while QuantumLayers handles the connections, joins and statistics. The statistics come from real calculations on your data rather than from a language model guessing at numbers.
Putting it together: a realistic workflow
Here's how the pieces fit for a typical team, such as a 40-person SaaS company with no analyst.
The operations lead connects the Postgres database behind the product, the CRM through its REST API and the finance team's Google Sheet of monthly targets. She doesn't write SQL, so she uses the query generator to describe "active accounts with their plan, signup date and last login," checks the explanation, and saves the result as a dataset.
She merges the product data with the CRM on account ID, using a left join so accounts with no CRM activity are kept. She reads the statistical summary first, catches that one revenue field is stored in cents, and sticks to the field stored in dollars. The ranked insights show that accounts using the reporting feature have noticeably higher renewal rates, and ANOVA shows that plan tier explains a meaningful share of the variation in seat count, while signup month explains almost none.
She saves two charts from the recommendations and builds a weekly report that combines insights with those charts for the leadership team every Monday morning. Then she sets a daily monitor on the merged dataset, filtered to enterprise accounts, that posts to the customer-success Slack channel whenever a new statistical finding appears or an old one disappears.
From then on, the analysis runs itself. When something changes, the team hears about it without anyone having to look.
Limits worth knowing
QuantumLayers is honest about its scope, and users should be too. The automatic analyses are descriptive and comparative. They show what moves together, which groups differ and how series trend. They don't establish cause and effect, and one-way ANOVA looks at one grouping at a time, so it can't separate two factors that overlap, such as region and company size. Questions like those eventually need an analyst and a purpose-built model.
The quality of every result also depends on the data that goes in. Merges are only as good as the shared keys, and data collected from self-reported or incomplete sources describes the people who reported, not the whole market. The statistical summary, the gap between Pearson and Spearman correlations, and effect sizes rather than p-values are the platform's built-in ways of keeping you honest about that. They work best when someone actually reads them.
The bottom line
The first article described QuantumLayers as a way to get statistical insight without a data team. Looked at closely, it's a fairly complete pipeline. It connects to eight SQL engines, REST APIs, Google Sheets, SFTP, Kaggle and files. It merges sources with standard joins and runs summaries, Pearson and Spearman correlations, ANOVA with proper effect sizes, and Holt-Winters and SARIMA forecasts. It explains results in plain language and delivers them through scheduled reports and change-detecting monitors to email, Slack or any system that accepts a webhook.
None of it removes the need for judgment. But it moves analysis from a task someone has to find time for to something that runs in the background and speaks up when it matters. For teams whose data is scattered and whose analysts are nonexistent, that's a meaningful change.
Learn more and try it at quantumlayers.com.