
IQR Outlier Calculator
Our free IQR outlier calculator uses the interquartile range
by info2936
FreeWeb
- Upvotes
- 0
- Comments
- 0
- Impressions
- 2
this week
discussions
this week
About
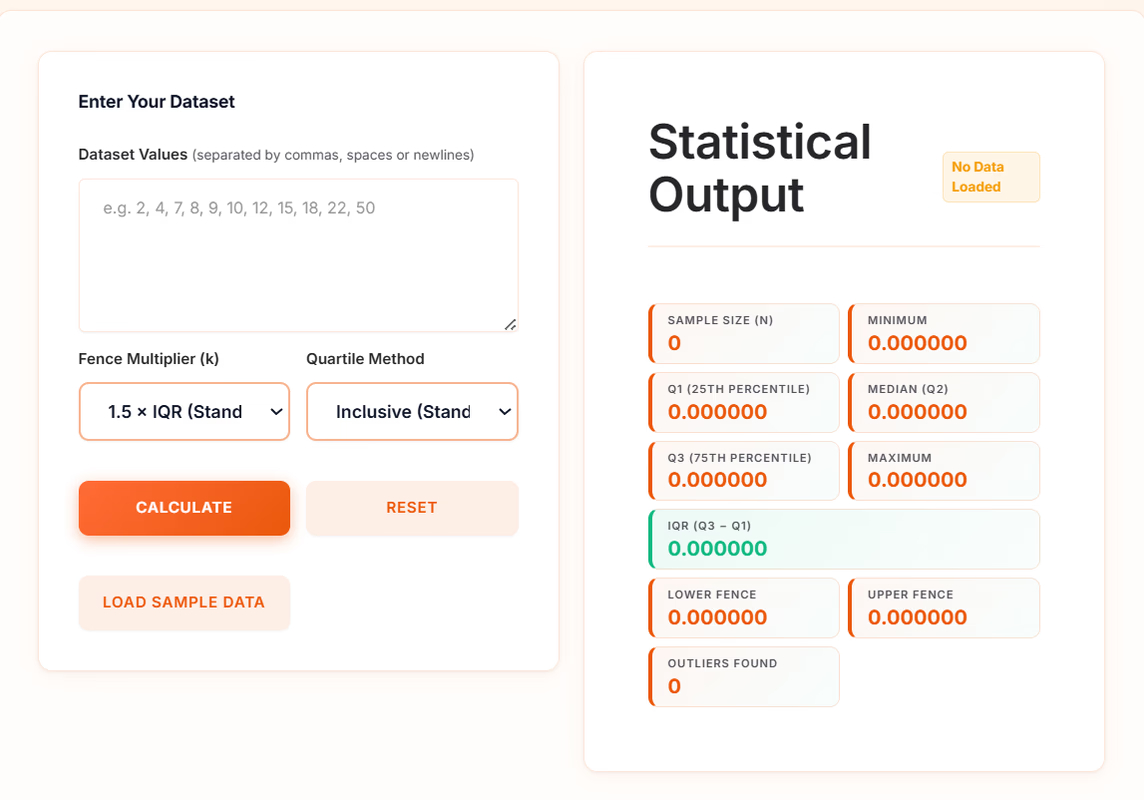
Introduction to the IQR Outlier Calculator An IQR outlier calculator is a statistical tool that uses the interquartile range (IQR) to identify data points that fall significantly outside the central spread of a dataset. In descriptive statistics, outliers are observations that deviate markedly from other values and can distort measures of central tendency such as the mean, inflate the standard deviation, and lead to misleading conclusions in regression analysis, hypothesis testing, and data visualization. The IQR method is one of the most widely taught and universally accepted techniques for detecting outliers because it is robust to non-normal distributions and resistant to the influence of extreme values themselves. By using this iqr outlier calculator, you can quickly analyze distribution spreads and make data-driven decisions. Whether you are a college student completing a statistics homework assignment, a data analyst cleaning a real-world dataset, or a researcher screening clinical trial measurements before analysis, knowing how to find outliers using a robust iqr outlier calculator is a foundational skill. This outlier calculator with Q1 and Q3 automates the entire process: you enter your data, and the tool instantly returns the five-number summary, the IQR, the inner and outer fences, a visual box plot, and a full step-by-step mathematical breakdown rendered in publication-quality LaTeX notation. Every data point is classified as normal, a mild outlier, or an extreme outlier so you can immediately see which observations require further investigation.
Problem & solution
Problem
Students struggle to identify outliers using the interquartile range (IQR) method.
Solution
Calculate IQR, quartiles, and outliers quickly with clear results.
Who it's for
Statistics students, researchers, teachers, and data analysts.
Main features
- Calculates Q1 and Q3 automatic
- Finds the interquartile range.
- Calculates lower and upper out
Use cases
- Check statistics homework and identify outliers.
- Analyze datasets and detect unusual values.
Comments
0 shownShare your thoughts about this tool.
Sign in to leave a comment.
No comments yet. Be the first to leave one.