

- Upvotes
- 0
- Comments
- 0
- Impressions
- 5
this week
discussions
this week
About
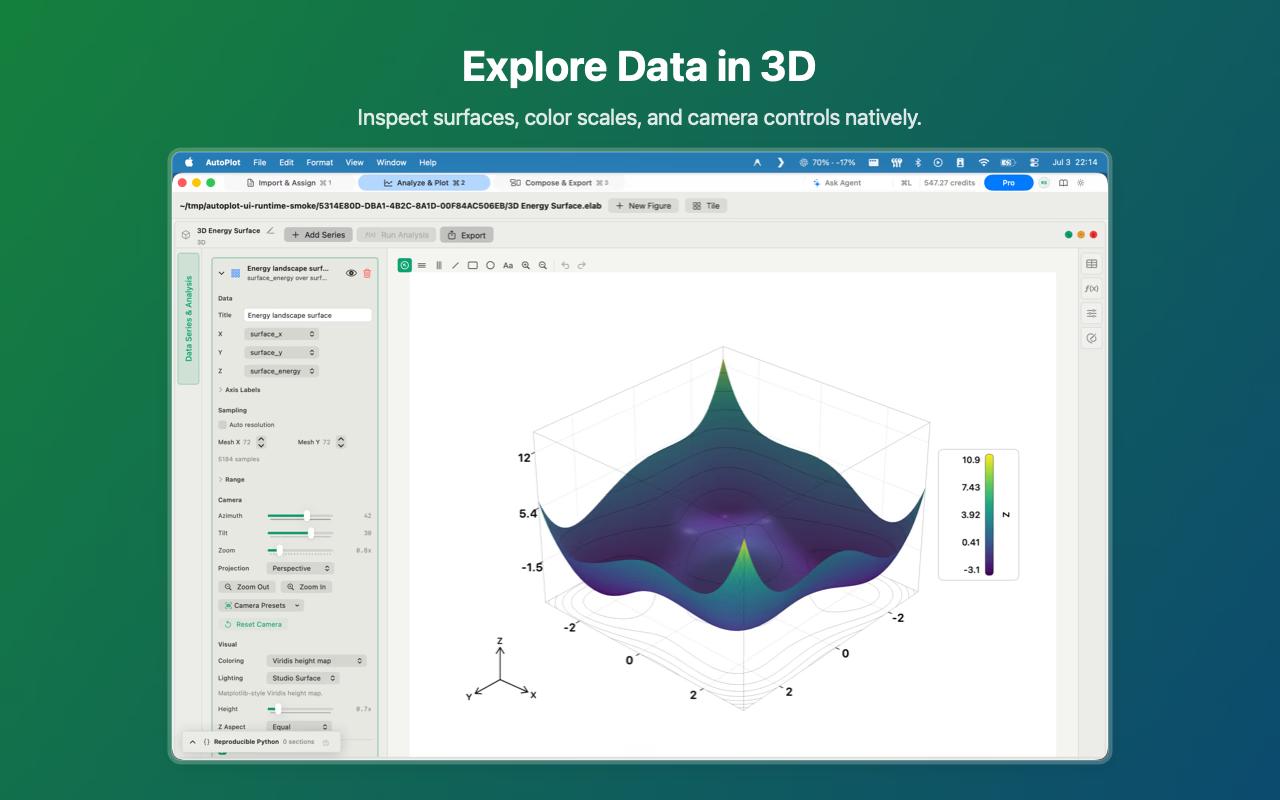
Autoplot is a native macOS workspace for importing, analyzing, plotting, and publishing scientific data. It combines local file and SFTP import, header processing, file merging, reusable analysis results, and interactive visualization in one application. Built-in tools cover X-Y plots, histograms, heat maps, 3D visualizations, correlation analysis, CCDFs, log-binned distributions, power-law fitting, finite-size scaling, and scaling relations. Users can annotate figures, combine plots into multi-panel boards, and export vector PDFs, PNGs, JPGs, or runnable Python and Matplotlib code. An optional conversational assistant can generate and execute local Python, control application functions, and help create analyses without receiving raw data values. The main scientific toolkit runs locally and can operate offline using bundled Python libraries. Autoplot is intended for students preparing coursework figures, scientists producing reviewable analyses, and R&D teams that need to keep raw data on their Macs.
Problem & solution
Problem
Scientific plotting often requires repeated transfers between code, AI, and editing tools.
Solution
A local Mac workspace combines data import, analysis, plotting, annotation, and export.
Who it's for
Students, scientists, and R&D teams analyzing and presenting scientific data.
Main features
- Local data import
- Scientific analysis tools
- 2D and 3D plotting
- AI-assisted Python
- Publication-ready export
Use cases
- Turn experimental CSVs into fitted plots
- Create publication-ready multi-panel figures
Comments
0 shownShare your thoughts about this tool.
Sign in to leave a comment.
No comments yet. Be the first to leave one.