

- Upvotes
- 0
- Comments
- 0
- Impressions
- 9
this week
discussions
this week
About
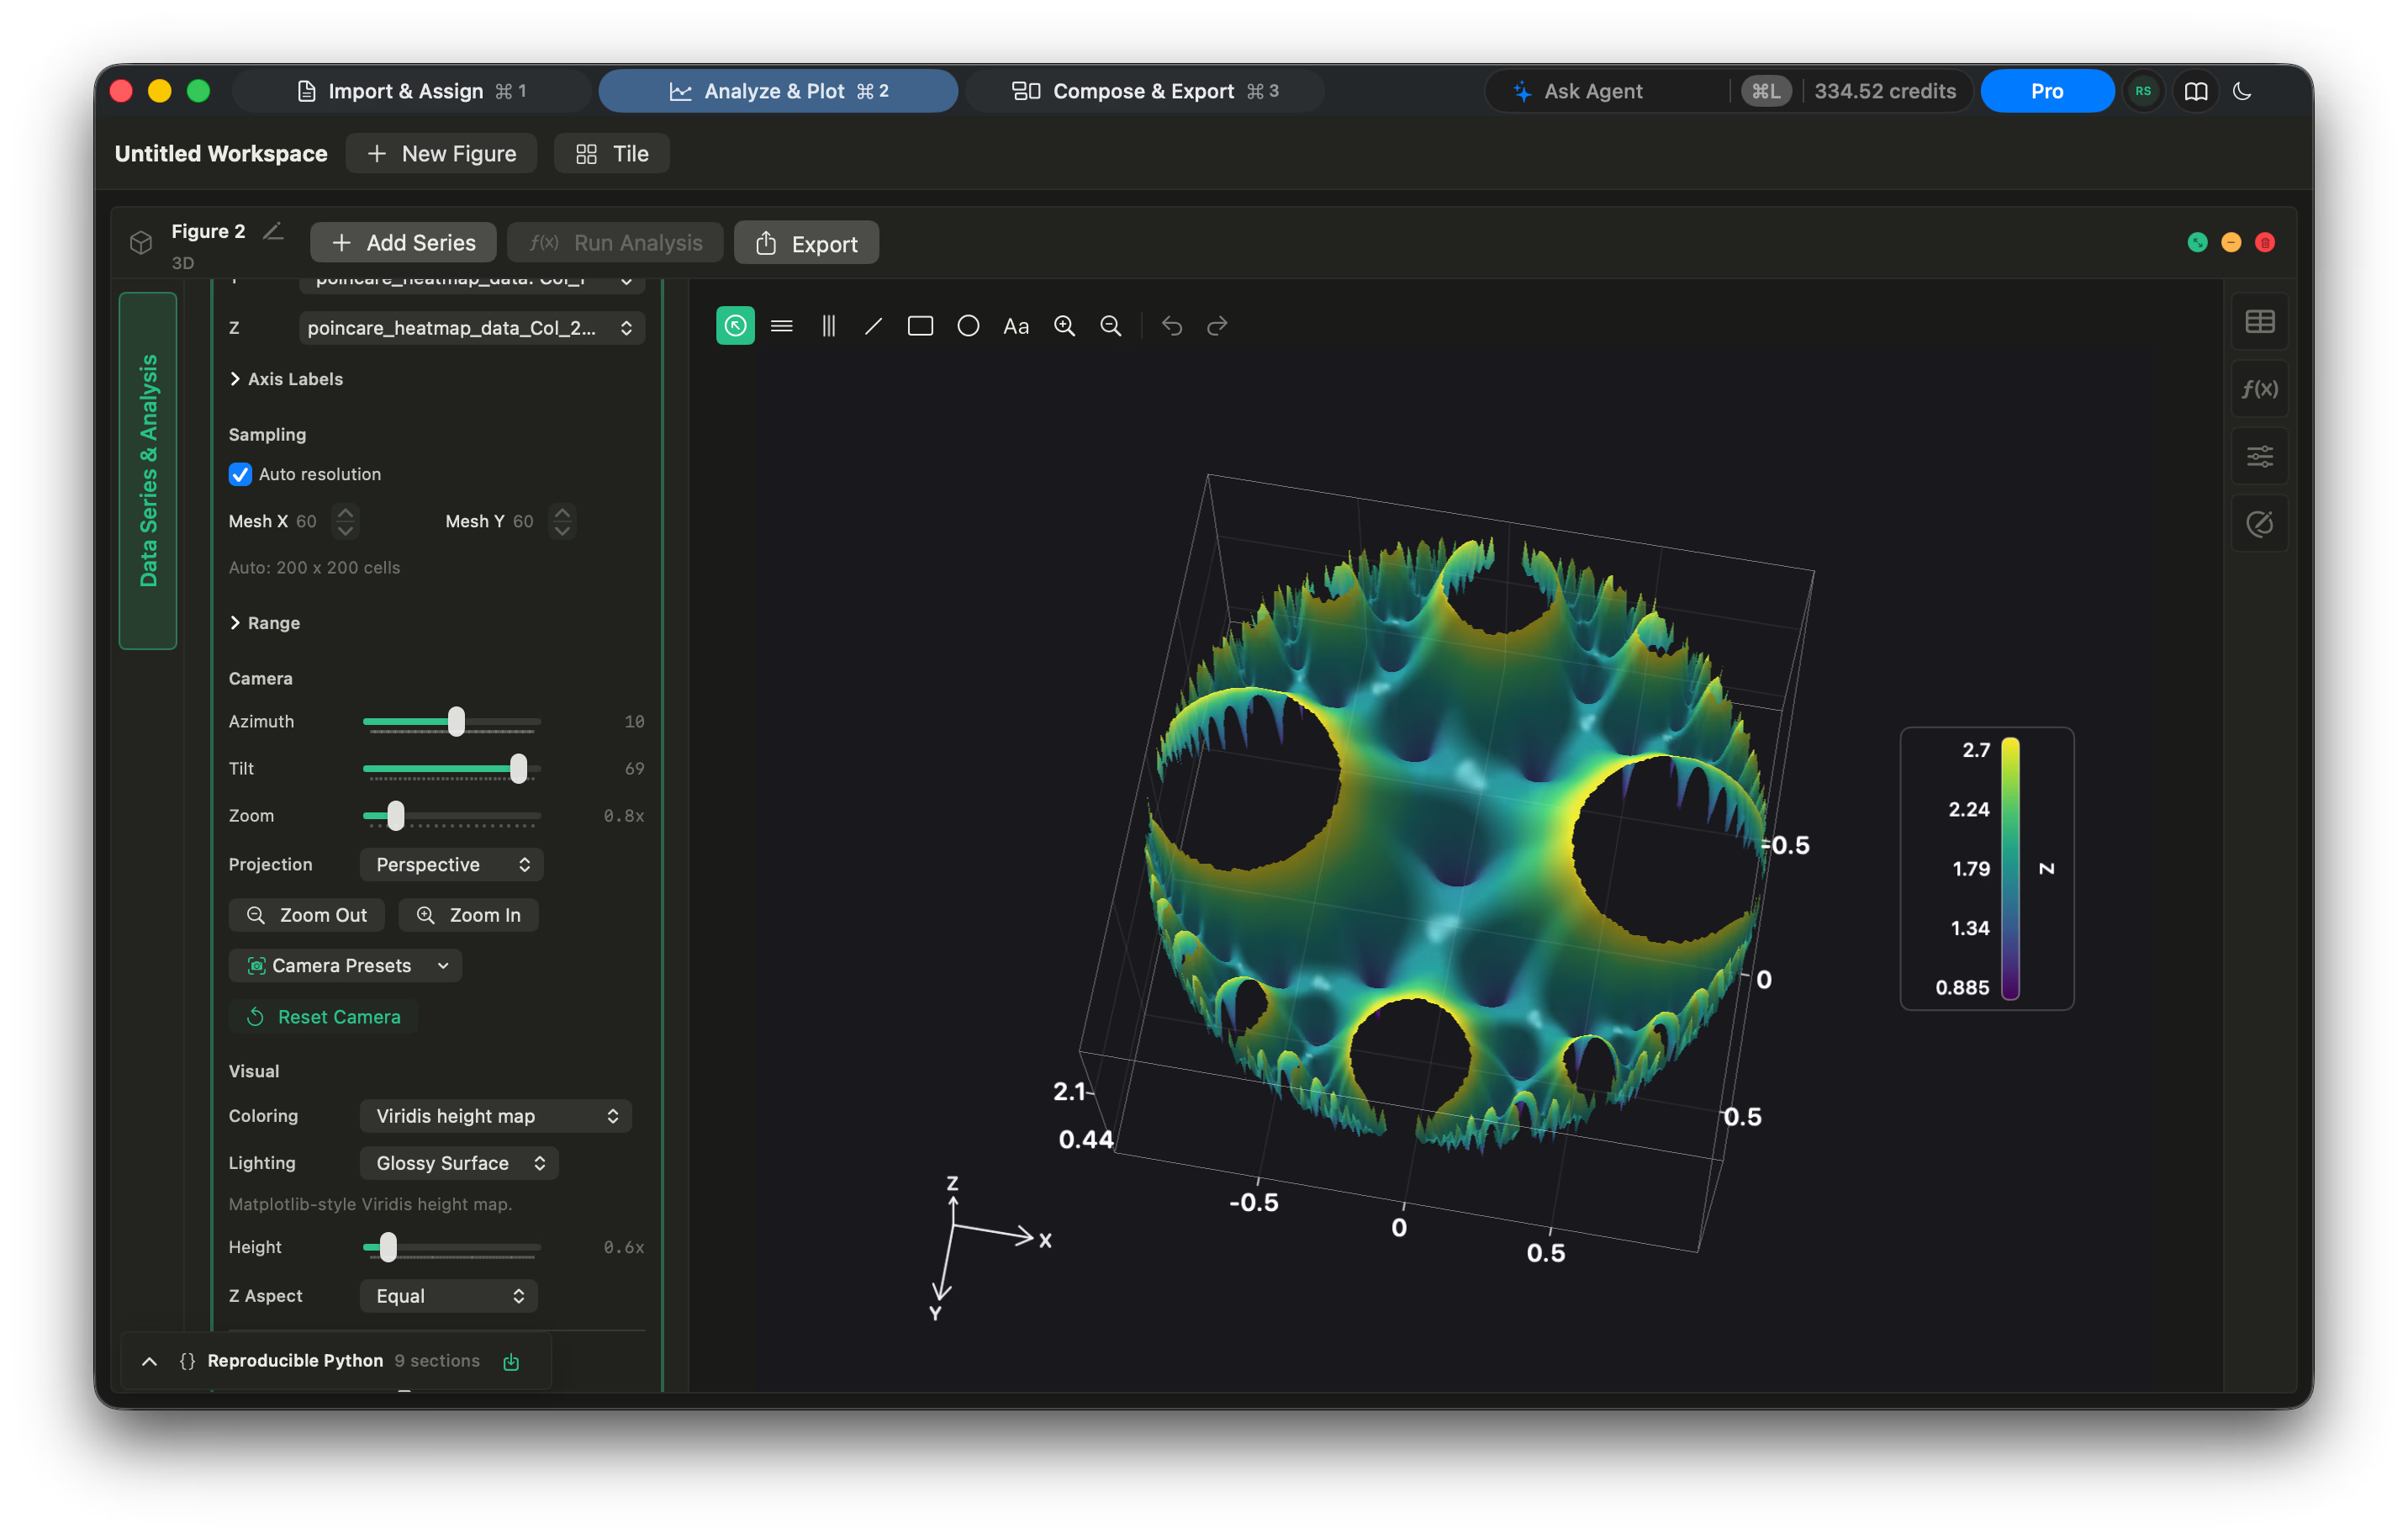
Autoplot is a native macOS workspace for scientific data analysis, plotting, and figure preparation. It is designed to reduce the need to move repeatedly between Python scripts, AI assistants, terminals, plotting software, and image editors. Users can import local or SFTP data, merge and process datasets, create 2D and 3D plots, histograms, heat maps, and categorical charts, and perform analyses including CCDF, log-binned distributions, power-law fits, finite-size scaling, scaling relations, and correlations. An optional AI assistant can generate Python for custom analysis while raw data remains on the Mac; the assistant works from user intent and dataset schema rather than raw values. Analysis outputs remain reusable for further fitting, plotting, and composition. Autoplot also supports in-figure annotations, multi-panel Compose boards, vector PDF export with embedded fonts, PNG and JPG output, and export of analyses as runnable Python and Matplotlib code.
Problem & solution
Problem
Scientific plotting requires fragmented workflows across code, AI, editors, and plotting tools.
Solution
Autoplot unifies data import, analysis, plotting, annotation, and export in a native Mac app.
Who it's for
Students, scientists, researchers, and R&D teams working with scientific data on Mac.
Main features
- Scientific plotting
- Statistical analysis
- AI-assisted Python
- Plain english file processing
- Publication-ready export
Use cases
- Analyze data and create paper-ready plots
- Fit distributions and export figures
Comments
0 shownShare your thoughts about this tool.
Sign in to leave a comment.
No comments yet. Be the first to leave one.