
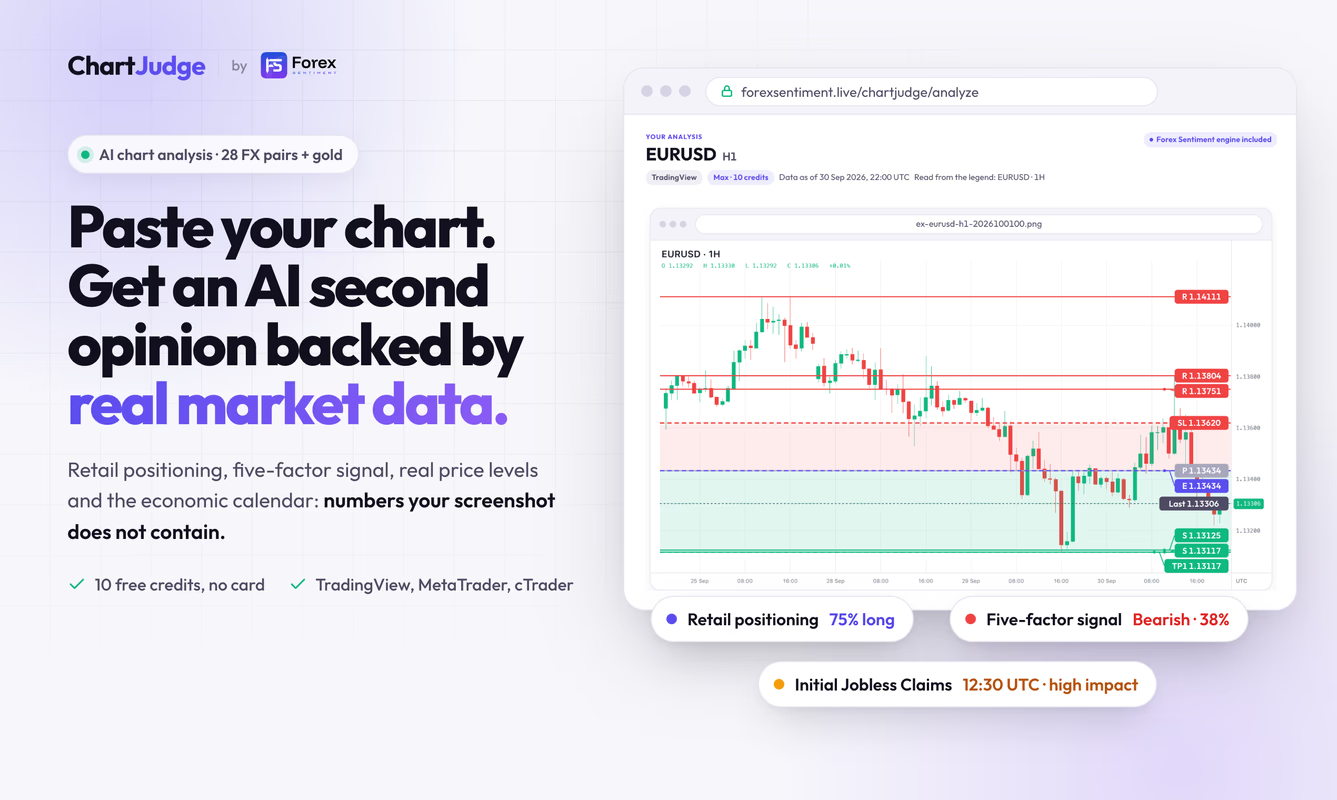
If you already have a forex chart open in TradingView, MetaTrader, cTrader, or another trading platform, you do not always need to rebuild your analysis from scratch. An AI chart analyzer lets you upload a screenshot and turn the chart into a structured second opinion. The process is simple: provide a clear screenshot, identify the market and timeframe, then review the AI analysis alongside your own trading plan.
Learning how to analyze a forex chart screenshot with AI is useful when you want another perspective before entering a trade. Instead of asking AI for a simple buy or sell prediction, you can use it to examine market structure, support and resistance, chart patterns, possible bullish and bearish scenarios, and potential entry and exit levels.
One tool built specifically for this workflow is Forex Sentiment ChartJudge. It analyzes screenshots from common charting platforms and combines the visible chart structure with additional forex market data.
Why Analyze a Forex Chart Screenshot With AI?
Manual chart analysis takes time. You need to identify the current trend, find important price levels, inspect recent candles, check patterns, consider multiple timeframes, and review market events before deciding whether a setup is worth watching.
AI does not replace this process. Instead, it gives you a structured second opinion.
A forex chart screenshot contains a large amount of visual information. It shows candles, price movement, timeframes, support and resistance drawn on the chart, indicators, and other technical information. An AI vision model can inspect these visual elements and organize them into a readable analysis.
The bigger limitation is that a screenshot does not contain everything happening in the market. It does not automatically show current retail positioning, upcoming economic events, broader currency strength, or updated market data outside the visible chart.
This is why a useful AI forex chart analyzer should combine chart interpretation with market data when available.
What You Need Before Uploading a Forex Chart
The quality of your screenshot affects the quality of the analysis. Before uploading a chart, make sure the important information is visible.
- The currency pair or instrument
- The timeframe
- The current price scale
- A reasonable amount of recent price action
- Candles that are easy to see
- Important indicators you want analyzed
- Any relevant support or resistance zones
A clean TradingView, MetaTrader, or cTrader screenshot usually works better than a heavily cropped image. Avoid covering the chart with menus, order windows, notifications, or unrelated application elements.
For example, if you want to analyze EUR/USD on the H1 timeframe, the screenshot should clearly show EUR/USD, H1, the recent candles, and the price scale. This gives the AI enough visual context to understand what you are looking at.
Step 1: Identify the Market and Timeframe
Start by confirming the currency pair and timeframe. This sounds simple, but it is an important part of chart analysis.
EUR/USD on a 15-minute chart tells a different story from EUR/USD on a daily chart. The same price movement can represent a short-term pullback on one timeframe and a major trend change on another.
Higher timeframes are useful for understanding broader market direction. Lower timeframes are often used for more precise entry planning.
A useful workflow is to start with a higher timeframe such as D1 or H4, then move toward H1 or a lower timeframe when looking for a potential entry.
If your AI tool supports multiple screenshots, you can provide several timeframes from the same market. This helps create a more complete view instead of relying on a single chart.
Step 2: Ask AI to Read the Market Structure
One of the first things you should look for is market structure.
Ask the AI to determine whether the chart appears to be trending upward, trending downward, ranging, or transitioning between conditions.
For an uptrend, you might see a sequence of higher highs and higher lows. A downtrend often contains lower highs and lower lows. A ranging market tends to move between recognizable support and resistance areas without establishing a strong directional structure.
This matters because your trading plan should match the market environment.
For example, buying every pullback during a strong uptrend follows a different logic from buying near the bottom of a sideways range. An AI analysis gives you another interpretation of the structure before you make a decision.
Step 3: Check Support and Resistance
Support and resistance are among the most important parts of forex chart analysis.
Support represents an area where price has previously found buying interest. Resistance represents an area where selling pressure has appeared. These areas are rarely perfect single-price lines. They often work better as zones.
When analyzing a screenshot, ask where the important levels are and how far the current price is from them.
A useful analysis should also explain why a level matters. A level with multiple previous reactions is more interesting than a random line drawn through the middle of a move.
Real price data adds another layer of accuracy. Instead of relying only on pixels in a screenshot, ChartJudge uses real market prices for its supported markets. This helps when generating specific levels, entries, stops, and targets.
Step 4: Look for Chart Patterns and Candlestick Behavior
After identifying the market structure and key levels, examine the recent price action.
AI chart analysis is useful for identifying visual patterns such as bullish and bearish engulfing candles, doji formations, channels, breakouts, pullbacks, and other recognizable structures.
Do not treat a pattern as an automatic trading signal. A pattern becomes more useful when it appears in the right market context.
For example, a bullish reversal pattern near an established support area has a different meaning from the same pattern appearing in the middle of a large range.
A good AI analysis should connect patterns with their location on the chart rather than listing patterns without context.
Step 5: Build Bullish and Bearish Scenarios
One of the most useful ways to analyze a forex chart is to stop asking, “Will price go up or down?”
Instead, build two possible scenarios.
The bullish scenario explains what needs to happen for buyers to remain in control. The bearish scenario explains what needs to happen for sellers to take control.
For example, a bullish scenario might require price to hold above support and break a nearby resistance level. The bearish scenario might become more likely if price breaks below support and fails to recover.
This approach helps you define invalidation levels. If your original idea stops making sense after a specific price movement, you know when to step back instead of forcing the trade.
Step 6: Review the Entry, Stop, and Target
Once the scenarios are clear, review the potential trade plan.
A structured forex analysis should answer several questions:
- Where would the potential entry be?
- Where would the setup become invalid?
- Where is a reasonable first target?
- Where is a second target?
- What is the potential risk-reward ratio?
This is more useful than receiving a simple statement such as “EUR/USD looks bullish.” A trading idea needs a clear structure.
For example, an analysis might identify an entry near support, place the invalidation below the support zone, and identify resistance as a potential target. The risk-reward ratio then gives you another metric for evaluating the setup.
Keep in mind that a good risk-reward ratio does not guarantee a profitable trade. It is one part of the decision-making process.
Step 7: Add Forex Sentiment to the Chart Analysis
A screenshot shows price action, but it does not show how retail traders are positioned.
Forex sentiment provides another source of information. It shows the percentage of retail traders positioned long or short on a market.
ChartJudge combines this information with its chart analysis for supported forex markets and gold. The engine also provides a five-factor market signal, real price levels, patterns, currency strength, volatility information, and economic calendar events.
This creates a broader analysis than looking at candles alone.
For example, a chart might show a possible bullish setup while retail positioning is heavily concentrated on the long side. This does not automatically invalidate the setup, but it gives you additional context to consider.
Sentiment should be treated as context rather than a standalone trading signal.
Step 8: Check the Economic Calendar
Forex markets react strongly to economic releases. Interest-rate decisions, inflation reports, employment data, central bank announcements, and other major events often create sudden price movements.
A technically attractive setup can change quickly when a major economic event approaches.
This is one reason chart screenshots have limitations. Your screenshot shows what happened on the chart, but it does not automatically tell you what economic event is scheduled next.
An AI forex analysis tool with economic calendar data gives you another layer of context. Instead of reviewing the chart in isolation, you can see whether a scheduled event might affect the setup.
Step 9: Use Multiple Timeframes When Possible
Single-timeframe analysis often misses important context.
Suppose EUR/USD looks bullish on H1. The D1 chart might still be approaching a major resistance zone. The H4 chart might also show a broader downtrend.
Looking at D1, H4, and H1 together gives you a better understanding of where the short-term setup sits within the larger market structure.
A multi-timeframe workflow often follows this structure:
- Use D1 to understand the broader direction and major levels.
- Use H4 to identify the intermediate structure.
- Use H1 or a lower timeframe to examine the potential entry.
The important part is consistency. Do not switch between timeframes until you find one supporting the trade you already want to take.
How to Get Better AI Forex Chart Analysis
There are several simple ways to improve the quality of your analysis.
- Use a clear screenshot with the price scale visible.
- Include enough historical candles to show market structure.
- Confirm the correct currency pair.
- Confirm the correct timeframe.
- Keep important indicators visible when they matter to your strategy.
- Use higher timeframes for broader context.
- Ask for both bullish and bearish scenarios.
- Look for invalidation levels instead of only predictions.
- Check important economic events before acting.
- Compare AI-generated levels with your trading platform.
The goal is not to make AI decide everything for you. The goal is to make your chart review more structured.
What AI Should Not Do for Your Trading
AI analysis works best as a second opinion.
A chart analyzer does not know your complete financial situation, risk tolerance, trading history, or personal strategy. It also does not remove uncertainty from the market.
Even a well-structured analysis can be wrong. Markets move unpredictably, news can change sentiment, and technical patterns fail.
For this reason, focus on the reasoning behind the analysis rather than blindly following an entry or direction.
Ask yourself whether the proposed level makes sense on your actual chart. Check whether the invalidation point fits your strategy. Review the potential risk before considering any position.
Chart Screenshot Analysis vs Manual Analysis
Manual analysis gives you complete control over the process. You choose the indicators, identify the levels, study the candles, and develop your own scenarios.
AI analysis gives you a faster second perspective.
The two approaches work well together.
You might first analyze EUR/USD yourself and mark your preferred support zone. Then you upload the screenshot to an AI chart analyzer and compare its interpretation with yours.
If both analyses identify similar market structure and levels, you have stronger confirmation for further research. If they disagree, the difference gives you something specific to investigate.
This makes AI more useful as a review tool than as a replacement for learning technical analysis.
Who Should Use an AI Forex Chart Analyzer?
This workflow is useful for several types of traders.
- Beginners learning how to structure chart analysis
- Day traders reviewing setups before entering
- Swing traders comparing multiple timeframes
- Forex traders who want a second opinion
- Traders who already use TradingView or MetaTrader
- Traders who want to document and review trade ideas
It is especially useful when you already have a chart open and want a structured review without manually explaining every visible detail.
A Simple Forex AI Analysis Workflow
You do not need a complicated process.
- Open your forex chart.
- Choose the currency pair and timeframe.
- Take a clean screenshot.
- Upload or paste the screenshot into an AI chart analyzer.
- Confirm the detected market and timeframe.
- Review the market structure.
- Check support and resistance.
- Review chart patterns.
- Compare bullish and bearish scenarios.
- Check the proposed entry, stop, targets, and risk-reward.
- Review sentiment and economic events.
- Compare the result with your own analysis.
This workflow turns a simple screenshot into a structured checklist for trade research.
Try AI Forex Chart Analysis
If you already use TradingView, MetaTrader, cTrader, or a broker chart, you have the main input required for screenshot-based analysis.
ChartJudge accepts chart screenshots and produces a structured second opinion covering trend, levels, patterns, scenarios, and potential trade ideas. On its supported forex markets and gold, the analysis also adds retail positioning, market signals, real price levels, and economic calendar information.
You can start with free credits and test the workflow on your own chart before deciding whether it fits your trading routine.
For more tools covering finance, productivity, development, AI, marketing, and other categories, visit NxGn Tools.
Final Thoughts
Learning how to analyze a forex chart screenshot with AI is less about finding an automatic buy or sell button and more about creating a repeatable chart-review process.
A useful analysis starts with market structure. It then moves through support and resistance, patterns, multiple scenarios, invalidation, risk-reward, sentiment, and economic events.
The biggest advantage is speed and structure. You provide the chart you already use, and AI helps organize the information into a second opinion you can compare with your own analysis.
Use the result as part of your research process. Keep your own trading rules in control, verify important price levels, and treat every setup as a possibility rather than a guaranteed outcome.