
What Can You Actually Do With QuantumLayers? Twelve Practical Use Cases Across SaaS, Sales, Marketing, Finance, Operations, Energy, HR and Public Data
The first four articles in this series explained how QuantumLayers works. This one shows what to do with it. We walk through twelve concrete use cases, from churn analysis and pipeline monitoring to budget forecasting, vendor file tracking, weather-sensitive planning and client reporting, with the sources to connect, the analyses to run and the reports and alerts to set up for each.
Over four earlier articles, we've taken QuantumLayers apart piece by piece. We covered the databases, APIs, spreadsheets and file servers it connects to, the statistics it runs, how its insight engine finds structural breaks and forecasts, and how a messy real dataset behaves when you push it through the whole pipeline. That's the "how." This article is about the "what."
The most common question people ask after seeing a demo of an analytics tool isn't technical. It's "what would I actually use this for?" Platforms like QuantumLayers are general-purpose by design, and the generality can make it hard to see where to begin. So instead of another tour of features, here are twelve specific jobs the platform does well, organized by the team or business that would do them. For each, we describe the data you'd connect, what you'd look for, which parts of the platform do the work and what you'd set up to keep it running.
A few of the examples use public datasets we analyzed in QuantumLayers, so you can see what real output looks like. The rest describe common business situations. None of them requires an analyst.
The building blocks
Every use case below is a combination of the same six building blocks, so it helps to name them once.
Connect. Datasets come from SQL databases (MySQL, PostgreSQL, SQL Server, Redshift, ClickHouse, Synapse, BigQuery and Databricks), REST APIs that return JSON, Google Sheets, CSV and Excel files from a URL, SFTP servers, Kaggle and direct uploads. Connected datasets can be re-synced to pick up new data.
Merge. Two or more datasets can be joined on a shared column, such as a customer ID, email address or date, using inner, left, right or outer joins. The result is a new dataset that behaves like any other.
Analyze. The platform computes statistical summaries, Pearson and Spearman correlations, ANOVA with effect sizes, regression models, and, for anything with dates, trends, seasonality, structural breaks, lead-lag relationships and Holt-Winters and SARIMA forecasts.
Explain. The insight engine ranks findings and describes each in plain language with a recommendation. You can focus it with a prompt, limit it to certain columns and filter it to one segment.
Deliver. Scheduled reports send a set of datasets, insights and saved views by email, as HTML or PDF, daily, weekly or monthly.
Watch. Monitors re-check datasets on a schedule and alert you when a statistical finding appears or disappears, by email, in Slack or through a signed webhook to another system.
Most of the value comes from combining them. Connecting alone gives you a copy of your data. Connecting, merging and watching gives you an early-warning system.
1. SaaS: understanding churn and renewal
The question. Why do some customers renew and others leave, and can you tell which ones are at risk before they go?
The data. Churn questions almost always cross three systems. Product usage lives in your application database, account and contract information lives in your CRM, and support history lives in your help desk. In QuantumLayers you'd connect the application database with a SQL query that returns one row per account with usage figures such as weekly active users, features used and last login. You'd connect the CRM and help desk through their REST APIs. If nobody on the team writes SQL, the plain-English query generator can produce the usage query from a description like "active accounts with seats, plan, signup date, last login and number of reports created in the last 90 days," along with an explanation of what the query does.
The analysis. Merge the three sources on account ID, using a left join from your account list so customers without tickets or recent activity stay in the dataset. Those quiet accounts are often the most important ones. Then run the analyses. ANOVA compares renewal rates or usage across plan tiers, company sizes or acquisition channels, and its effect sizes tell you which groupings genuinely matter. Correlations show whether feature adoption, seat count or ticket volume move with renewal. A segment filter lets you check whether a pattern found across all customers holds within your largest plan.
Keeping it running. Set a weekly monitor on the merged dataset. If a new relationship appears, such as support tickets starting to correlate with churn in your enterprise segment, the customer-success team hears about it in Slack the same week rather than at the next quarterly business review.
2. Sales: pipeline health and win rates by segment
The question. Which deals close, which stall, and is anything changing?
The data. Most of the answer is in the CRM: opportunities with their stage, amount, owner, source, region, industry, created date and close date. Connect it through its API, or through the database behind it if your CRM is self-hosted.
The analysis. The statistical summary is the first stop, because pipeline data is full of the problems we've written about before: deal values of zero that mean "not yet estimated," test opportunities and amounts entered in the wrong currency. Once the data is clean, ANOVA on deal size and sales-cycle length by region, industry or lead source shows where real differences exist. Read the effect sizes rather than the p-values. With a few thousand opportunities, almost every grouping will look "significant," but only a few will explain enough of the variation to change how you prioritize leads.
Time-series analysis on monthly bookings detects trends, seasonality and structural breaks. A break in average deal size after a pricing change is exactly what you want to confirm or rule out.
Keeping it running. A weekly report to the sales leadership team can combine ranked insights on the pipeline with a focus prompt such as "focus on changes in win rate and deal size by segment." A daily monitor filtered to the current quarter's opportunities flags new findings as they emerge.
3. Marketing: connecting spend to results
The question. Which channels actually produce revenue, and how long does it take?
The data. Marketing spend is often tracked in a Google Sheet, while signups and revenue live in the product database or billing system. Ad platforms and analytics tools can be connected through their APIs. The key is to bring everything to a common time grain, usually weekly, with one row per week and one column per channel.
The analysis. This is where lead-lag analysis earns its place. QuantumLayers shifts each spend series forward and backward against signups or revenue, on first-differenced data so a shared upward trend doesn't create false relationships, and reports which series leads, by how many periods and how strongly. A finding that paid search spend leads trial signups by one week, or that webinar attendance leads enterprise pipeline by six weeks, tells you both what works and how long to wait before judging a campaign.
Treat these findings as hypotheses. As we discussed in our insight-engine article, a lead-lag relationship on a short series can clear the significance threshold by chance. The most trustworthy ones make business sense, appear at a plausible lag and keep reappearing as new data arrives.
Keeping it running. That last test is exactly what a monitor does. Set one on the merged spend-and-results dataset, and a relationship that holds up week after week becomes something you can plan budgets around.
More on QuantumLayers marketing use cases: https://www.quantumlayers.com/growth-marketing
4. Finance: budgets, actuals and forecasts
The question. Are we on track, and where will we land?
The data. In many small and mid-sized companies, the budget lives in a spreadsheet and actuals come from the accounting system or a billing database. Connect both. Google Sheets datasets let you point at a specific tab and cell range, which is useful when a budget workbook has several sheets.
The analysis. With at least 12 periods of history, the insight engine forecasts each monthly series using both Holt-Winters exponential smoothing and SARIMA. It reports the model settings, the typical forecast error and whether the two methods agree. When they do, you can be more confident in the direction. When they don't, the honest answer is that the future is uncertain, and that's useful information for a cash-flow plan.
There's one trap specific to finance data. Keep budgets and actuals in separate columns or datasets, and make sure the forecast only learns from actual results. A forecast trained on a column that mixes historical actuals with future budget figures is a forecast of your own plan. We saw the same effect in our analysis of IMF growth data, which includes the IMF's own projections several years ahead.
Keeping it running. A monthly report to the leadership team, sent a few days after close, can include the forecast findings for revenue, costs and cash alongside any structural breaks the engine detects. A break in gross margin is something a finance lead wants to see flagged, not discover three months later.
More on QuantumLayers finance use cases: https://www.quantumlayers.com/finance-accounting
5. E-commerce and retail: demand, seasonality and promotions
The question. When do customers buy, what drives it, and did the last promotion actually work?
The data. Orders from the store's database or platform API, product and category information, and a calendar of promotions, which is often a simple spreadsheet. Merge orders with the promotion calendar on date.
The analysis. Seasonal decomposition is the core tool here. QuantumLayers separates a time series into its seasonal pattern, its underlying trend and what's left over. It reports how strong the seasonality is and when the cycle peaks and bottoms out.
To see what that output looks like, we ran it on ten years of daily solar irradiance data from NASA's POWER service for Ames, Iowa, a series with an obvious annual cycle. The engine reported a seasonal strength of 0.99 on a scale where 1 means the pattern explains essentially all the variation, with a peak around the week of June 7 and a low around the week of December 20. It also reported that the underlying trend explained only 7% of the remaining variation. In other words, the sunshine follows the calendar almost perfectly and isn't drifting up or down over the decade.
Retail data is noisier, but the same output answers the same questions: how strong is our seasonal cycle, when does it peak, and is there an underlying trend once the season is removed? Recommendations follow the same logic, such as planning inventory around the cycle rather than reacting to any single week.
Promotions are a natural fit for structural-break detection and ANOVA. A break in order volume that coincides with a promotion, or a meaningful effect size when comparing promotion weeks with ordinary ones, is evidence the promotion moved the needle. A difference that disappears once you account for the seasonal peak it happened to coincide with is evidence it didn't.
Keeping it running. A monitor on daily orders filtered to your top categories can flag an unusual break or a change in seasonal behaviour while there's still time to adjust stock.
More on QuantumLayers ecommerce use cases: https://www.quantumlayers.com/e-commerce-retail
6. Energy and weather-sensitive businesses
The question. How much does the weather affect our business, and what should we expect next?
The data. Your own operating data, such as energy generation, deliveries, store traffic or service calls, plus public weather and climate data. QuantumLayers' API connector works directly with sources such as Open-Meteo, NOAA and NASA POWER, so a weather dataset can be set up once and re-synced as new observations arrive.
The analysis. For a solar installer or energy company, the NASA data above is the operating data. The forecasts the engine produced from it illustrate how to read seasonal models. Because the data ended in late December, both the Holt-Winters model, which used a damped trend so it doesn't extrapolate indefinitely, and a seasonal SARIMA model with a 52-week cycle projected irradiance to rise steadily over the following 12 weeks. The two models agreed, and the projections are simply the arrival of spring.
The reported percentage increases were very large, several hundred percent, because the starting point was the darkest week of the year. As with any forecast that starts near a seasonal low, read the projected values themselves rather than the percentage.
For businesses that are affected by weather rather than measuring it, merge daily weather onto your daily operating data by date and run correlations and lead-lag analysis. A landscaping company, a restaurant with a patio or a roofing contractor can see how much rain or temperature explains, and whether a cold snap shows up in demand the same week or a week later.
Keeping it running. A monitor on the merged dataset will notice if the relationship changes, for example if a new indoor offering makes the business less weather-dependent.
More on QuantumLayers energy use cases: https://quantumlayers.com/energy-utilities
7. Customer support operations
The question. Are we keeping up, and what's driving the workload?
The data. The help desk, connected through its API: tickets with created and resolved times, channel, category, priority, assigned team and satisfaction score.
The analysis. ANOVA on resolution time by category, channel and team shows where time is really going, and effect sizes separate meaningful differences from noise. Structural-break detection on weekly ticket volume or average resolution time is particularly valuable in support, because many changes are sudden: a product release, a new self-service article, a pricing change, a staffing change. The engine reports the date of the break and the averages before and after.
Remember the caution from our case study. A sudden change can reflect the world or the way it's measured. A drop in resolution time might mean the team got faster, or it might mean a new automation started closing tickets instantly. The break tells you where to look.
Keeping it running. Monitor alerts can be routed by webhook into the same tools the support team already uses, and limited to particular finding types, such as structural breaks and forecast changes. A cooldown window prevents the same borderline finding from triggering repeated alerts.
8. HR and compensation benchmarking
The question. Are we paying competitively, and are our own pay structures consistent?
The data. Internal compensation data from the HR system, kept private, plus external benchmarks. Public salary datasets are available on Kaggle and from survey publishers, and QuantumLayers can import Kaggle datasets directly.
The analysis. Our first article in this series analyzed 151,445 AI, machine learning and data salaries in QuantumLayers. ANOVA showed that experience level explained about 10% of the variation in pay, with median salaries rising from $86,600 at entry level to $130,000 at mid level, $161,000 at senior level and about $189,000 for executives. Job title explained about 20%. Company size and remote-work status, though statistically significant on such a large dataset, explained less than half a percent each.
The same analysis on your own data answers internal questions. How much of the variation in pay is explained by level and role, which should be most of it, and how much by factors that shouldn't matter? Effect sizes are the right lens for this kind of question, because they measure how much a factor matters, not merely whether it's detectable.
A note on privacy. Compensation data is sensitive. Keep the dataset private, limit who can see reports built on it, and share only aggregated findings.
9. Operations and supply chain: vendor files and delivery performance
The question. Are suppliers and carriers delivering on time, and is anything getting worse?
The data. A great deal of operational data still arrives as files: a carrier's daily delivery report, a supplier's inventory file or a warehouse's shipment log, dropped on an SFTP server overnight. QuantumLayers can collect a named file from a remote directory using a password or SSH key and re-sync it to pick up each new delivery. Connect your own order system alongside it.
The analysis. Merge shipments with orders on order number, then compare delivery times or late-delivery rates across carriers, warehouses, regions and product categories with ANOVA. Structural-break detection on weekly on-time performance catches the week a carrier's service quietly deteriorated. Correlations show whether order size or destination distance explain delays.
Keeping it running. A daily monitor filtered by carrier, delivering to an operations Slack channel, turns a file nobody reads into an alert someone acts on.
More on QuantumLayers operations use cases: https://www.quantumlayers.com/manufacturing-production
10. Public sector, non-profits and research
The question. How do the communities, countries or programs we care about compare, and how are they changing?
The data. Organizations working with public data often spend more time collecting it than analyzing it. QuantumLayers' API connector handles sources such as the World Bank, the IMF, FRED and the US Energy Information Administration, including locating the data inside each source's response format.
The analysis. As an example, we connected the World Bank's life-expectancy indicator for 2000 to 2024. The dataset has 6,650 rows covering 266 entries. That count reveals something worth knowing about World Bank data. The entries include not just individual countries but regional and income-group aggregates such as "Africa Eastern and Southern," which appear in the same column as the countries they summarize. Some aggregates have no ISO country code, which is how you can tell them apart.
Analyzing countries and aggregates together double-counts people and distorts every comparison, so the first step is to separate them, either with a filter or by defining the dataset to exclude aggregates. After that, ANOVA compares regions or income groups, time-series analysis identifies trends and breaks, and merging with other indicators, such as health spending or GDP growth, shows how they relate.
The general lesson applies far beyond public data: before analyzing any dataset, check whether some rows are totals or subtotals of other rows.
Keeping it running. Public datasets are updated on their publishers' schedules. Re-syncing picks up new releases, and a monitor will flag when a new year of data changes a finding.
More on QuantumLayers research use cases: https://quantumlayers.com/research-monitoring-evaluation
11. Agencies and consultants: client reporting
The question. How do you give every client a regular, insightful report without building each one by hand?
The data. Each client's data, connected separately: their analytics, their sales database, their marketing spreadsheets. Dataset visibility settings keep each client's data private, shared only within your organization, or public where appropriate.
The analysis. The insight engine's focus prompts are especially useful here, because each client cares about different things. One report section can focus on "changes in conversion rate by channel," another on "seasonal patterns in bookings." The engine writes a plain-language narrative for each, which becomes the backbone of the report rather than something an account manager writes from scratch every month.
Keeping it running. Scheduled reports, one per client, go out as PDF on a monthly schedule in the client's own time zone, with each client's datasets as separate sections and saved views embedded. They can also be run on demand before a client meeting. Monitors can alert the account team when something changes for a client, so the agency hears about it before the client does.
More on QuantumLayers consulting use cases: https://www.quantumlayers.com/consulting-firms
12. Analysis through an AI agent
The question. Can someone ask questions of the data in conversation, without learning another tool?
The data. Whatever is already connected to QuantumLayers.
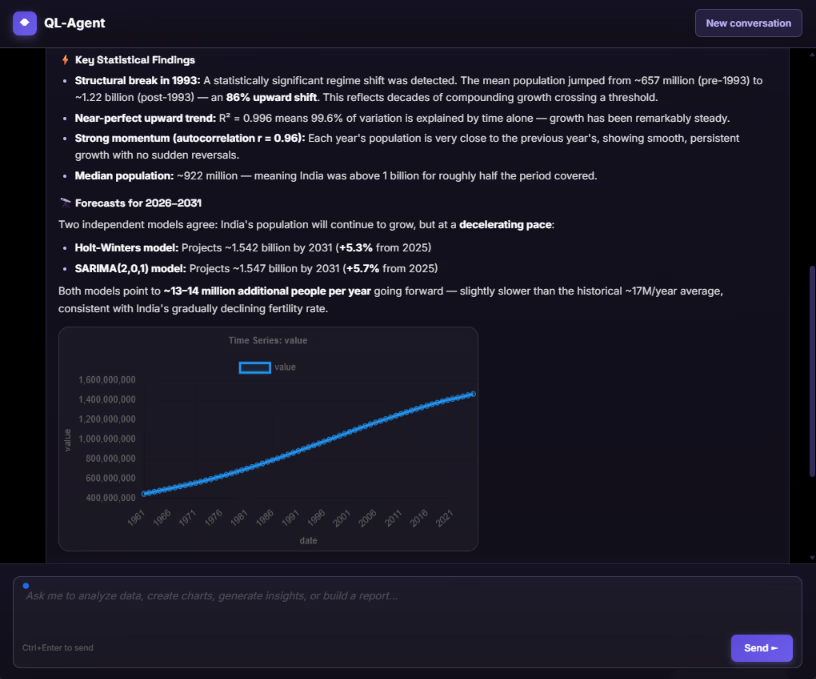
The analysis. QuantumLayers exposes its capabilities through the Model Context Protocol (MCP), an open standard for connecting AI agents to external tools. With the connection set up, a user can ask an agent to list datasets, summarize one, run correlations or ANOVA, generate insights with a particular focus, merge two sources or set up a report, all in conversation. Several of the analyses in this series were run that way.
The division of labour is the important part. The assistant handles the conversation and the explanation. QuantumLayers does the actual computation on the actual data. That means the numbers in the answer come from real statistical calculations rather than from a language model's guess, and the assistant can explain them, put them in context and suggest what to check next.
More on QuantumLayers agentic use cases: https://quantumlayers.com/agentic-ai
Where to start
Twelve use cases is a lot, and most teams should start with one. A sensible first project has three features. It answers a question someone already asks regularly, such as "why are customers churning?" or "are we on track this quarter?" It uses data you can connect in an afternoon, usually one database or API and one spreadsheet. And it has an obvious recipient for the results.
A practical first month might look like this. In the first week, connect the sources, read the statistical summaries and fix whatever they reveal, such as zeros that mean "missing," mixed units or totals mixed in with detail rows. In the second week, merge the sources, generate insights, narrow the columns to the ones that matter and try a focus prompt. In the third week, check the top findings against what you know about the business, and use segment filters to see whether they hold within your most important groups. In the fourth week, turn what survived into a scheduled report for the people who need it and a monitor that tells you when it changes.
After that, the work mostly runs itself, and the second use case is much faster than the first.
The bottom line
QuantumLayers is general-purpose by design, and that's its strength. The same six building blocks, connect, merge, analyze, explain, deliver and watch, answer churn questions for a SaaS company, delivery questions for a distributor, seasonality questions for a retailer and benchmarking questions for an HR team. What changes from one use case to the next is the data you connect and the question you ask, not the tool.
Across all twelve examples, the pattern is the same. The platform does the work that usually requires an analyst: pulling data together, running the right statistical tests, writing up the findings and watching for changes. You supply the part no tool can: knowing which questions matter and what the answers mean for your business.
Learn more and try it at quantumlayers.com.