
Why one check is not enough
A request to your API passes through several layers before it gets an answer:
1. DNS turns your domain name into an IP address.
2. TCP opens a connection to the right port on that IP.
3. TLS proves the server is who it claims to be, with a valid certificate.
4. HTTP is where your app finally reads the request and replies.
A failure at any layer means downtime for your users. But each failure looks different, and a check that only watches one layer will miss the others. If you only run an HTTP check and your domain expires, the check may fail with a confusing error and you will not know why. Watch each layer on purpose.
HTTP checks: catch app-level failures
An HTTP check sends a real request to your endpoint and looks at the answer. A good one does more than confirm the server replied. It checks:
- the status code (200, not 500 or 403),
- the response time (slow is a kind of down),
- the body content (the JSON field you expect is actually there),
- and headers or authentication, if your endpoint needs them.
This is the layer that catches a broken deploy, a database error behind the API, an expired API key, or a response that returns 200 with an empty or wrong body. A check that only asks "did it reply?" will call that healthy. Assert on the status code and on a piece of the body, so a wrong answer counts as a failure.
TCP checks: catch connection failures
A TCP check opens a plain connection to a host and port. It does not speak HTTP. It only asks: is something listening here?
That sounds basic, but it catches problems an HTTP check cannot explain well:
- the service crashed and nothing is on the port,
- a firewall or security-group change closed the port,
- a dependency your API needs is down, like a database, a cache, or a message queue.
TCP checks are useful for the parts of your stack that are not web pages: a Postgres port, a Redis port, an SMTP server, or a gRPC service. They are fast and low-level, so they tell you quickly whether the door is even open before you worry about what is behind it.
DNS checks: catch resolution failures
A DNS check resolves your domain and confirms it returns the record you expect. This is the layer people forget, and it is the one that takes everyone down at once.
DNS checks catch:
- an expired domain,
- a record that was edited by mistake,
- a DNS provider outage,
- a change that has not propagated the way you thought.
If DNS fails, your servers can be perfectly healthy and nobody can reach them. Point a DNS check at your domain and assert the answer, so a bad record shows up as a real alert and not as a vague timeout somewhere else.
Do not forget TLS and reachability
Two more checks round out the picture. A **TLS certificate check** warns you before the certificate expires, which is a silent failure that turns every HTTPS request into an error at midnight. A **ping check** confirms the host is reachable on the network at all, below any port or page. Both are cheap to run and save you from a whole class of "the site is down and I have no idea why" mornings.
Combine the layers, and check from several regions
You do not have to pick one. The right setup runs a check per layer:
- an HTTP check on the API endpoint, asserting the status code and a body field,
- a TCP check on the port of a dependency the API relies on,
- a DNS check on the domain,
- a TLS check on the certificate.
One more thing matters: run these from more than one region. A check from a single location can pass while users on another continent fail, because of regional DNS, network routing, or a geo-block. Checking from several regions shows you what your real users see.
Detecting is only half the job
Finding the failure is not enough. You need to hear about it and your users need to trust you.
- Alert the right person. Send the alert to Slack, Telegram, PagerDuty, or wherever your on-call actually looks.
- Open an incident automatically. When a check fails, record it, so you have a timeline instead of a scramble.
- Show a status page. Post the incident where customers can see it, so they are informed instead of guessing.
- Suppress flaps. One brief blip should not page anyone at 3am. Wait for a real, repeated failure.
How often should you run these checks?
Frequency is a trade-off. Check too rarely and a short outage can come and go before you notice. Check too often and you add load and create noise. For most APIs, once a minute is a good default. It is fast enough to catch real problems early, and calm enough to stay quiet the rest of the time. Raise the rate for the endpoints your business depends on, and lower it for background services that can wait.
A common mistake to avoid
One failed check does not always mean real downtime. A short network hiccup, a slow region, or a quick restart can trip a single check and clear a second later. If every blip pages you, you soon learn to ignore the alerts, and then you miss the one that matters. Wait for a failure to repeat two or three times before you call it an incident, and let planned maintenance suppress alerts on purpose.
Putting it together
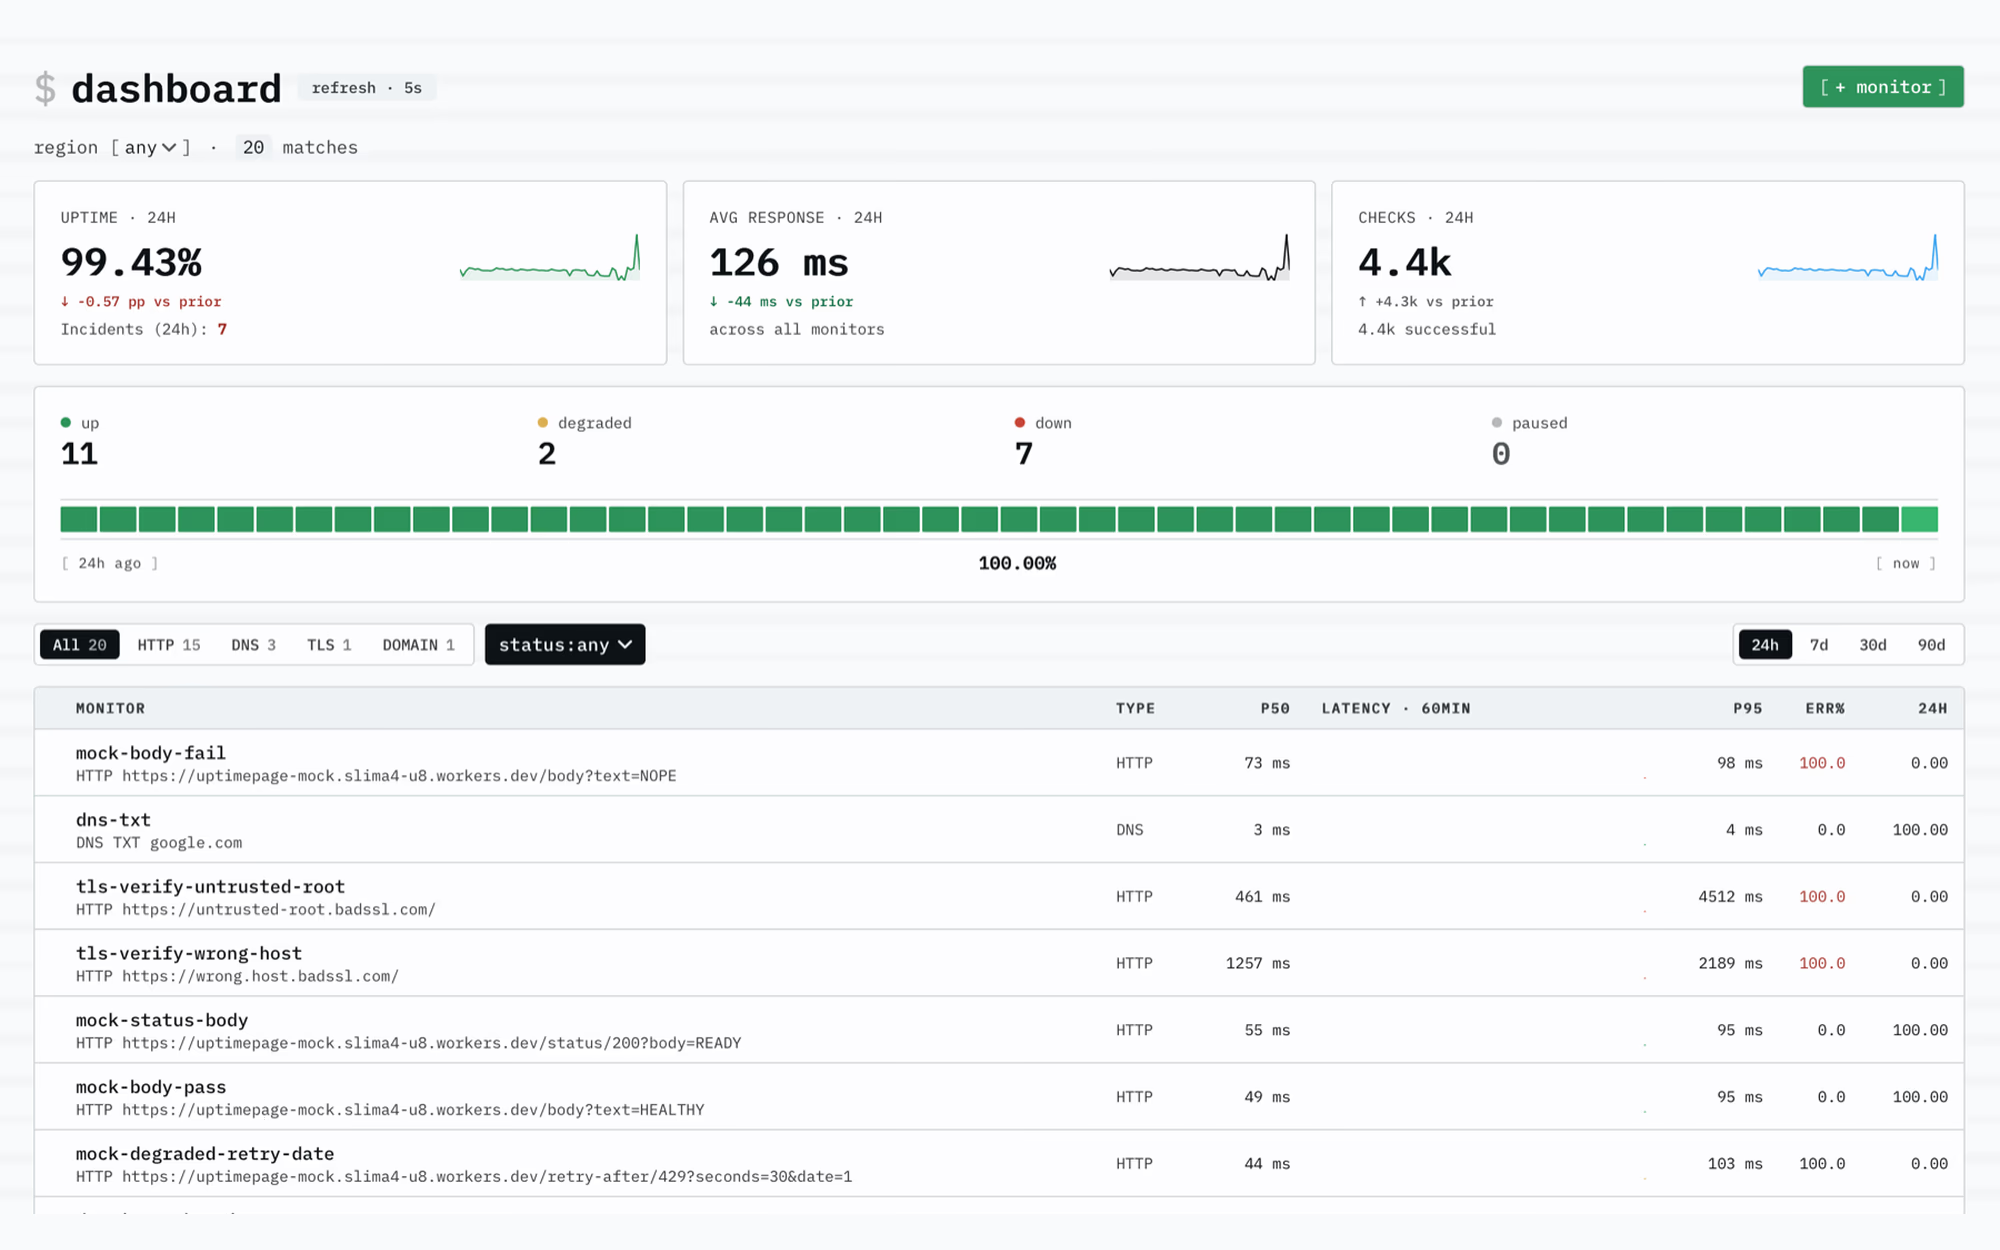
You do not need five tools for five layers. [Uptimepage](https://uptimepage.dev) runs HTTP, TCP, DNS, TLS, and ping checks from several regions, opens an incident automatically when one fails, and posts it to a public status page your users can see.
Watch every layer, alert the right person, and tell your users first. That is the whole job.
Articles
Developer ToolsSaaS Tools
How to Monitor API Downtime with HTTP, TCP, and DNS Checks
Your API can look "up" and still be broken. A health check returns 200, but real requests time out. The domain resolves on your laptop but not from another country. The port is open, but the TLS certificate expired last night. "Is the API up?" is not one question. It is several questions at different layers, and a single check type only answers one of them. This guide shows what HTTP, TCP, and DNS checks each catch, and how to combine them so you find out about downtime before your users do.
about Uptimepage
Jul 6, 20265 min read
Read more about
Uptimepage
Visit their tool page to learn more about their tool.
More tool articles
Related articles
Everything You Own Does Not Belong in Front of You During a Call
A growing image library and a useful presentation lineup are different things. Preparing a small, stable selection can make live conversations easier to manage without discarding the rest. Overlaysmith's upcoming Stage separates what you keep from what you plan to use.
OverlaysmithOct 11, 2026
A Place for Everything and Everything in Its Place - DeptOps
Discover why I created DeptOps after years of managing IT departments with spreadsheets, lists, and scattered information. From tracking responsibilities and backup ownership to improving visibility into recurring work, learn how my experience as an IT Director inspired a dedicated platform built around a simple philosophy: “A place for everything and everything in its place.”
DeptOpsOct 10, 2026
How to Choose a Webcam Overlay Format That Works in Real Video Calls
A transparent webcam frame can look right in an editor and fail in a call. Learn how file format, full-frame dimensions, real transparency, and receiver cropping affect the result, with a practical workflow for static overlays in Overlaysmith.
OverlaysmithOct 9, 2026